Credit data: China, US corporates feeling trade tensions
Dispute has ended a steady improvement in corporate credit risk
The G20 meeting in Osaka at the end of June brought a clutch of positive developments in the trade war between China and the US – a resumption of talks that had broken down in May, an accompanying ceasefire on new tariffs and a partial lifting of the US blockade of telecoms giant Huawei.
No-one should be getting too excited. For one thing, the official line on both sides is to expect a drawn-out negotiation. Speaking to CNBC on July 3, White House trade adviser Peter Navarro said the two sides had produced a seven-chapter document, covering 150 pages during the last, failed round of negotiations. Clearly, there is a lot of potential for talks to run aground again. A July 1 editorial in the China state-run People’s Daily, meanwhile, envisaged a “long and arduous” effort to put trade relations back on track.
For another, China and US corporates have already been feeling the strain for months – at least, if bank estimates of default risk are to be believed. Data on 2,375 US companies shows credit quality started to deteriorate in January this year.
The losses so far are minimal, but significant because they break an 18-month run of steadily improving strength.
Data on China corporates tells a similar story – a near-20% improvement in credit quality since the start of 2016, which peaked at the end of the first quarter of 2019 and is now deteriorating.
The other thing worth noting is that, while all eyes were on China and the US, the G20 summit itself offered further, worrying indications of a weakening of rules-based trade. The leaders’ 12-page declaration again omitted its traditional refutation of protectionist trade policies – reportedly, at the insistence of the US.
Elsewhere this month, we look at a new dataset on smaller UK corporates, which have struggled during the past year of Brexit mayhem. We also round up global sectoral trends, cover the credit risks of Brazil corporates and financials, and those of UK and US retailers.
Global credit industry trends
The latest bank-sourced credit data, based on 30+ financial institutions, shows that upgrade and downgrade activity has slightly increased, with 66 companies moving more than one notch, compared with 43 companies the previous month. Figure 1 shows detailed industry migration trends for the most recent published data, based on data adjusted for changes in contributor mix.
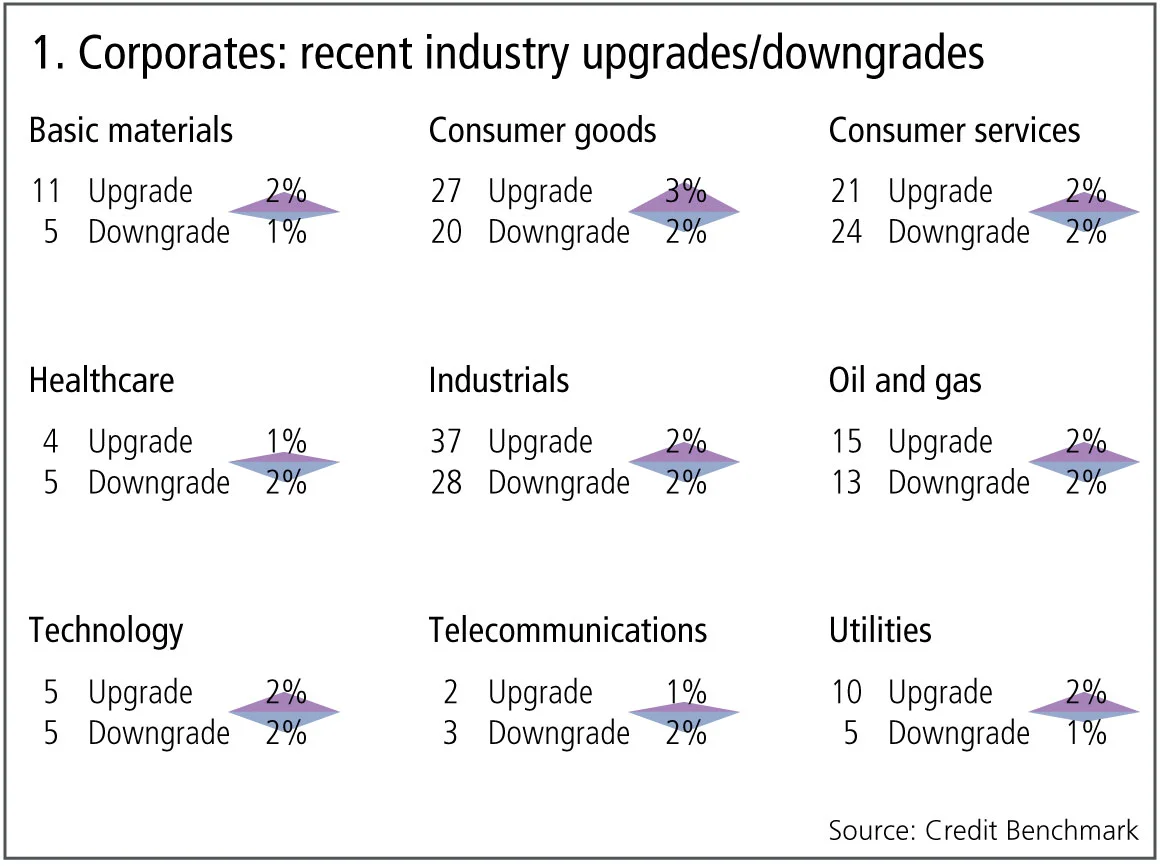
Figure 1 shows:
- Globally, the number of corporate upgrades and downgrades are in balance.
- Upgrades outnumber downgrades in one of the nine industries, three industries are biased towards downgrades and five are in balance.
- Basic materials continue to see upgrades dominating – a trend that has lasted more than half a year.
- Consumer goods see downgrades outweigh upgrades after two months of upgrades dominating.
- Consumer services return to downgrades outnumbering upgrades after two months of balance.
- Healthcare sees downgrades dominating, continuing its trend from last month.
- Utilities are in balance after six months of upgrades outweighing downgrades.
- Telecommunications are volatile, returning to balance after a month of downgrades outweighing upgrades.
- Oil and gas, industrials and technology continue to be in balance for the second month.
UK SME corporates
Brexit uncertainty has driven a steady deterioration in corporate credit across many industries in UK plc. A new addition to the consensus dataset covers small and medium-sized enterprises (SMEs) – defined in the UK as firms with less than £50 million ($62 million) in annual revenues.
Figure 2 compares the credit trends and distribution for SME corporates in England (63,900 firms), Scotland (4,890 firms) and Wales (2,380 firms).
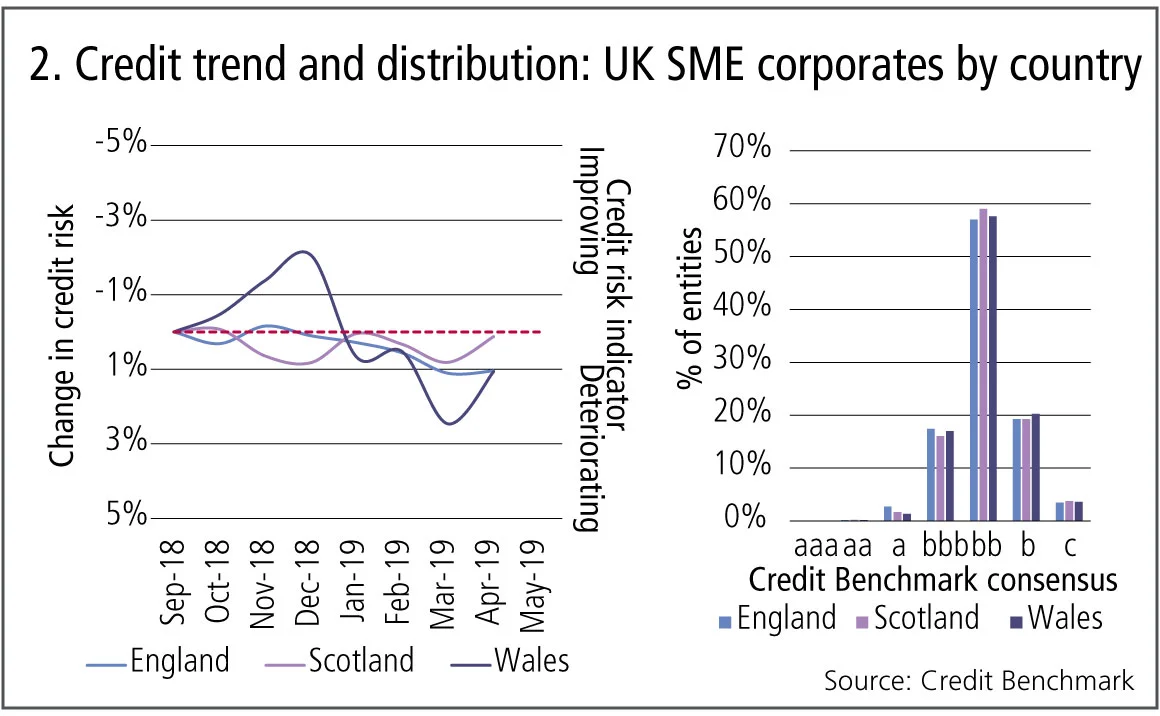
Figure 2 shows:
- SME corporates from all three countries have a similar distribution, with nearly 60% of entities in the non-investment-grade category of bb.
- Across these three countries, English SMEs show a slight deterioration of about 1% across the time period.
- Welsh SMEs are the most volatile of the three, partly because of the smaller sample size.
- Scottish SMEs show no strong trend so far.
Brazil
The Brazilian economy has faced some major hurdles in the past decade, with a sharp recession in 2014–16, which coincided with the impeachment of then-president Dilma Rousseff. The economy contracted 3.3% in 2016, but averaged a modest +1.1% growth in 2017 and 2018.
Despite a pro-business agenda, current president Jair Bolsonaro has had a tough start: optimistic GDP growth forecasts of more than +2% in 2019 were hit by Q1 data, which showed a decline of 0.2%; and the Industrial Entrepreneur Confidence Index has declined every month this year, falling from 64.7 in January 2019 to 56.5 in May 2019. But consensus credit data may show grounds for optimism.
Figure 3 shows the credit trends from August 2017 and distribution for 125 Brazilian corporates and 50 Brazilian financials.
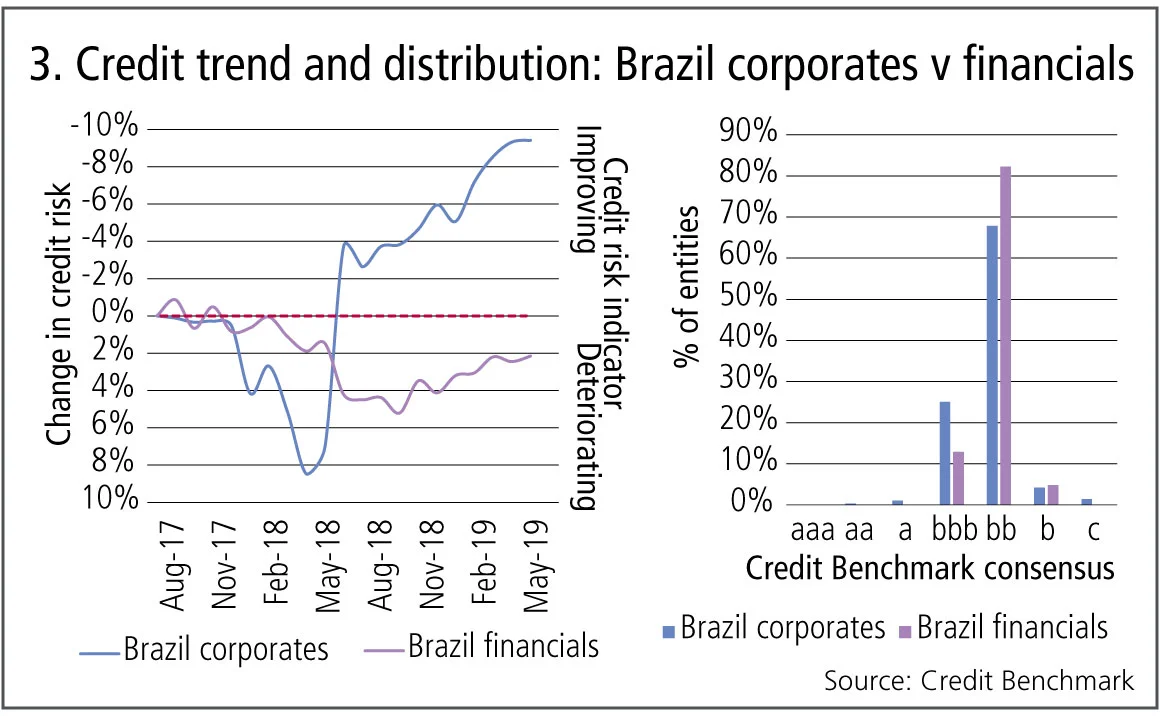
Figure 3 shows:
- Corporates rapidly deteriorated by 7% from November 2017 until May 2018. Financials continued to deteriorate until September 2018, declining by 5% from February 2018 to September 2018.
- After mid-2018, both corporate and financial credit risk have continued to improve. However, corporate credit risk improvement looks to be slowing in recent months.
- Financials have a higher credit risk level than corporates, with nearly 90% of credits in the non-investment-grade category, compared with 75% for corporates.
- Corporate credit risk shows a wider spread than financials. The latter are strongly concentrated in the bb category.
Chinese and US corporates
The China-US trade war has already had a material impact on Chinese exporters with knock-on effects across the economy, while Chinese inflation has hit a 15-month high. US sectors that are in a position to benefit from import substitution have seen some improvements, but for consumers the picture is more mixed; it has been estimated that the beneficial impact of the 2018 fiscal package has been significantly offset by higher import prices due to tariffs.
Figure 4 shows the credit trends and distributions of 250 Chinese corporates and 2,375 US corporates.
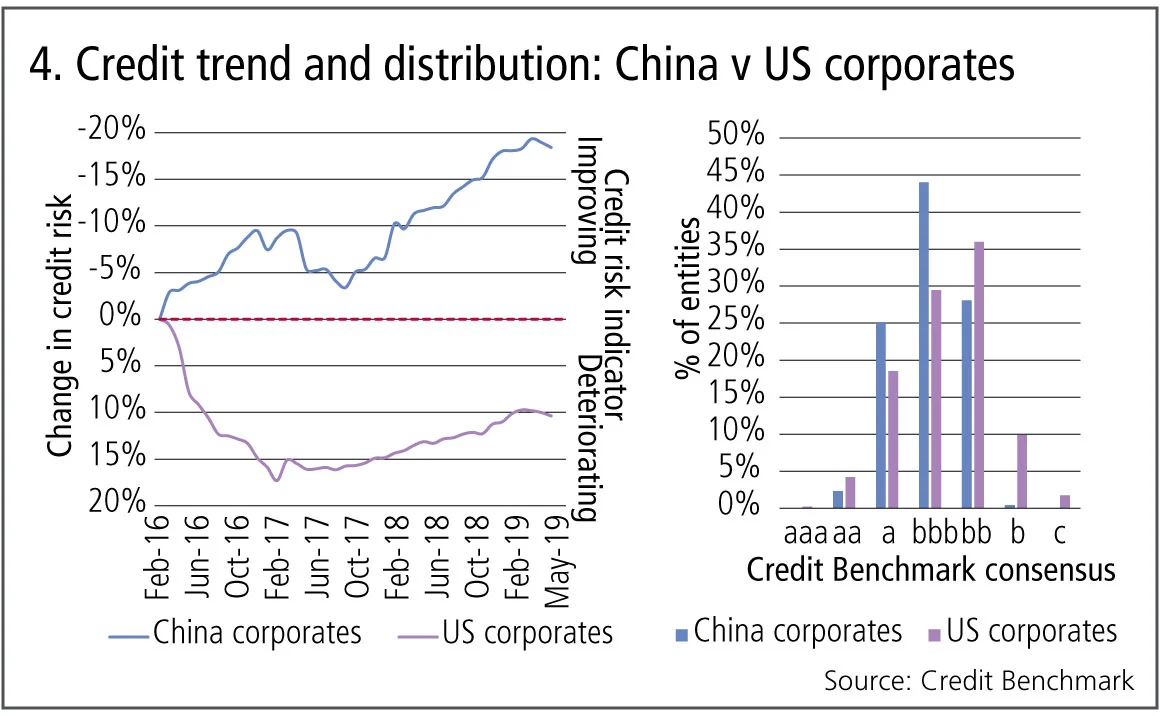
Figure 4 shows:
- US corporates showed a 17% deterioration in credit risk from December 2015 to December 2016, while for the majority of 2016, Chinese corporate credit risk improved, peaking at a 10% improvement by January 2017.
- Between December 2016 and January 2019, US corporates improved 4%, probably driven by Trump tax cuts. However, from January 2019, US corporate credit risk appears to be at a short-term turning point.
- After an eight-month trend of deterioration (December 2016 to July 2017), Chinese corporate credit risk began to improve once again, resulting in a nearly 20% improvement versus the original December 2015 level. But the latest two months suggest a possible turning point.
- The majority of Chinese corporates have a Credit Benchmark consensus of bbb, and the distribution is quite symmetrical about this point. For US corporates, the single largest category is bb, but the distribution is skewed: just over half of US corporates are investment grade.
UK and US general retailers
Much has been written about the “retail apocalypse” with waves of profit warnings and store closures. There are a number of reasons – the growth of online shopping, tight consumer budgets, overexpansion and high debt burdens – and even climate change making seasonal demand for clothing more unpredictable. The UK has the added impact of Brexit uncertainty.
Some retailers are fighting back: Urban Outfitters has announced a clothes rental programme while discount homestore B&M is reinvesting continued profit growth into new stores; but overall the sector is struggling.
Figure 5 plots comparative credit trends for 490 UK general retailers and 210 US general retailers since December 2015.
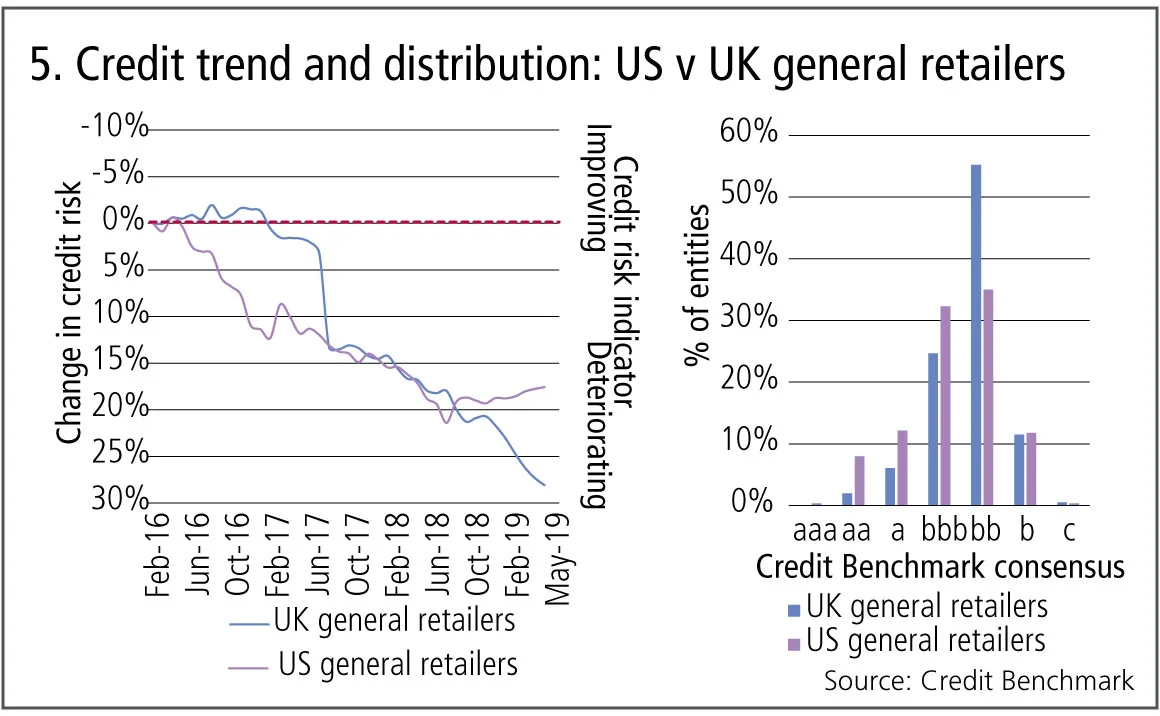
Figure 5 shows:
- Both the UK and US have deteriorated significantly since 2016.
- The UK decline is particularly marked: close to 30% and continuing to slide.
- The US declined 20% over the same period, but has shown a modest uptrend over the past 12 months.
- UK retailer credit quality is predominantly in the bb category and the majority of the overall distribution is non-investment grade.
- US retailer credit quality is more evenly spread and the majority are investment grade.
About this data
Credit Benchmark collects monthly credit risk inputs from 40-plus of the world’s leading financial institutions, making it possible to follow credit trends across geographies and industries. In all, the dataset contains consensus ratings on about 50,000 rated and unrated entities globally.
David Carruthers is head of research at Credit Benchmark.
Only users who have a paid subscription or are part of a corporate subscription are able to print or copy content.
To access these options, along with all other subscription benefits, please contact info@risk.net or view our subscription options here: http://subscriptions.risk.net/subscribe
You are currently unable to print this content. Please contact info@risk.net to find out more.
You are currently unable to copy this content. Please contact info@risk.net to find out more.
Copyright Infopro Digital Limited. All rights reserved.
As outlined in our terms and conditions, https://www.infopro-digital.com/terms-and-conditions/subscriptions/ (point 2.4), printing is limited to a single copy.
If you would like to purchase additional rights please email info@risk.net
Copyright Infopro Digital Limited. All rights reserved.
You may share this content using our article tools. As outlined in our terms and conditions, https://www.infopro-digital.com/terms-and-conditions/subscriptions/ (clause 2.4), an Authorised User may only make one copy of the materials for their own personal use. You must also comply with the restrictions in clause 2.5.
If you would like to purchase additional rights please email info@risk.net
More on Comment
Op risk data: Santander in car crash of motor-finance fail
Also: Macquarie fined for fake metals trade flaws, Metro makes AML misses, and Invesco red-faced over greenwashing. Data by ORX News
‘It’s not EU’: Do government bond spreads spell eurozone break-up?
Divergence between EGB yields is in the EU’s make-up; only a shared risk architecture can reunite them
Why there is no fence in effective regulatory relationships
A chief risk officer and former bank supervisor says regulators and regulated are on the same side
An AI-first approach to model risk management
Firms must define their AI risk appetite before trying to manage or model it, says Christophe Rougeaux
Op risk data: At Trafigura, a $1 billion miss in Mongolia
Also: Insurance cartels, Santander settlement and TSB’s “woeful” customer treatment. Data by ORX News
UST repo clearing: considerations for ‘done-away’ implementation
Citi’s Mariam Rafi sets out the drivers for sponsored and agent clearing of Treasury repo and reverse repo
Op risk data: Macquarie mauled by securities mismarks
Also: Danske’s costliest branch, tedious times for TD, and WhatsApp won’t stop. Data by ORX News
Climate stress tests are cold comfort for banks
Flaws in regulators’ methodology for gauging financial impact of climate change undermine transition efforts, argues modelling expert

