
Credit data: the Trump effect on PDs
The war on coal is over, according to the US president – and the effect can be seen in banks' default estimates

“Trump digs coal”, according to placards that are often seen at the US president’s rallies, and his year-old administration has taken a series of steps to protect the industry. In his speeches, he has promised an end to the “war on coal”, that mining jobs will be created, that the shrinking industry will return to growth.
One thing he has conspicuously not promised is an improvement in bank estimates of the one-year probability of default (PD) for coal companies – it’s not much of a rallying cry, perhaps, but there has been an improvement. For one set of 20 borrowers, the improvement in default expectations translates into a one-notch ratings upgrade, taking them from an average of b to b+ during a five-month period beginning in February 2017.
As the sector’s credit has strengthened, data suggests banks have become more comfortable lending to riskier names, presumably reflecting an expectation that the Trump policy tailwind will continue to help the sector.
Similar trends can be seen in the defence sector – an industry that is benefiting both from Trump policy and growing threats to regional and global security.
This month, we also look at the relationship between earnings surprises and credit quality for NYSE and Nasdaq-listed companies, and we compare bank-sourced credit data with credit default swap (CDS) prices.
Global credit industry trends
Figure 1 shows industry migration trends for the most recent published data.
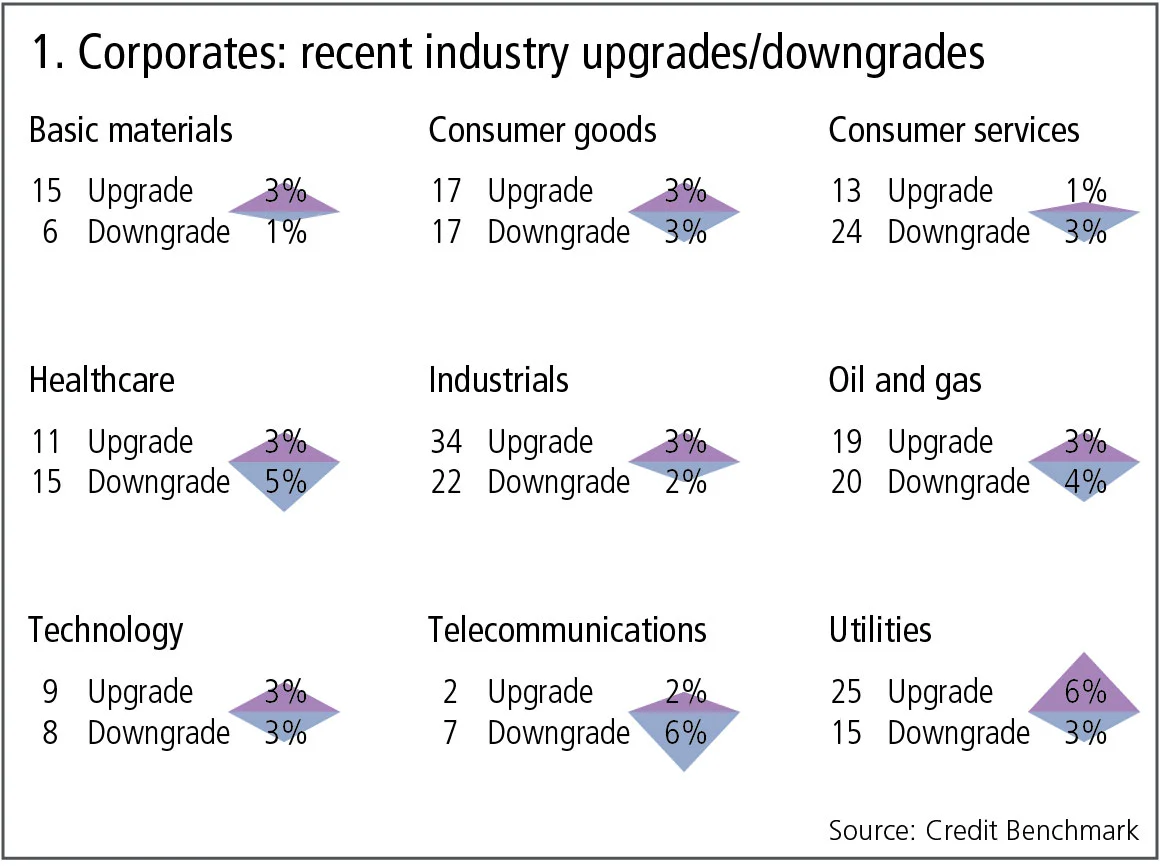
Figure 1 shows:
- Global corporate downgrades and upgrades are balanced, 3% of the global corporate obligors show a deterioration and 3% show an improvement.
- There are four industries where upgrades outnumber downgrades and four industries where downgrades dominate. Generally, the ratio of upgrades and downgrades has remained stable.
- The telecoms sector continues to show a strong imbalance in favour of downgrades, repeating the pattern of the past four months.
- In healthcare, downgrades have dominated upgrades for three consecutive months.
- Consumer services has reverted back to its pattern of downgrades significantly outnumbering upgrades.
- Basic materials and utilities show a continuing bias towards upgrades.
- Consumer goods, oil and gas, and technology remain balanced.
- The balance in industrials has moved in favour of upgrades.
US equity earnings surprises
The connections between equity and credit markets are often overlooked. Equity analysis typically focuses on value and growth metrics, with credit risk only becoming an issue when a company has run into severe problems, usually related to liquidity and the balance sheet. However, a comparison of recent earnings surprises in the main US markets for the past few months shows some interesting patterns across the credit spectrum. The distribution of the earnings surprises is shown relative to the credit distribution of the underlying index.
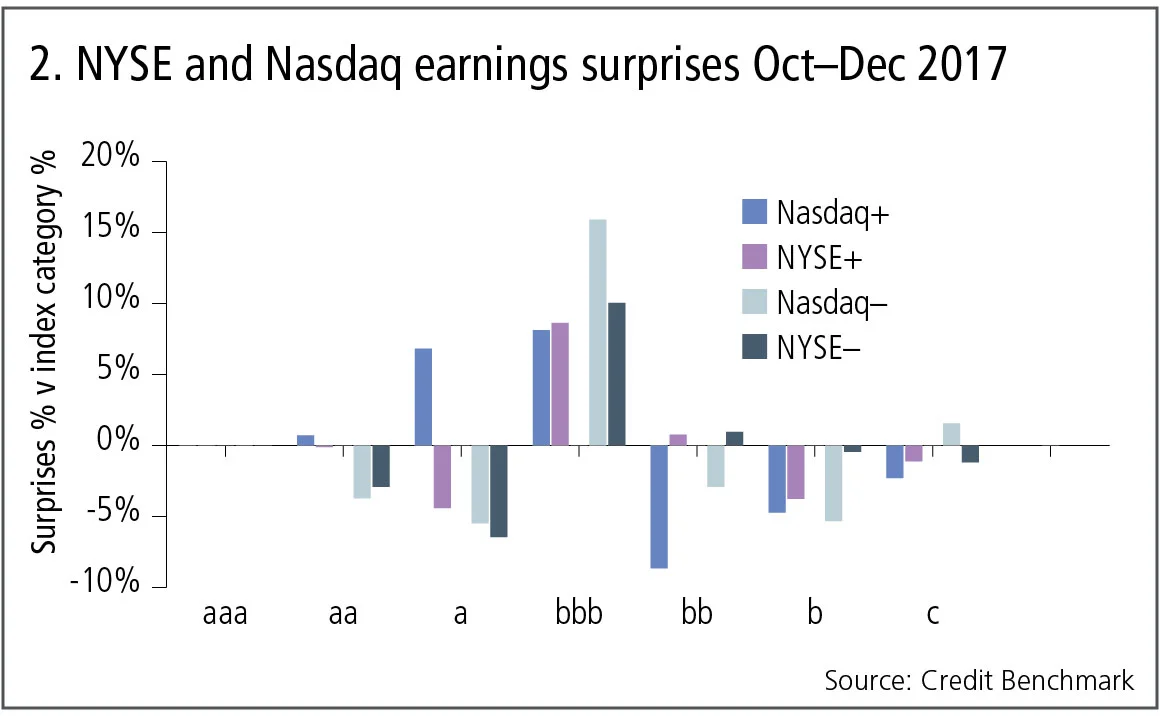
Figure 2 shows:
- For the NYSE, positive surprises are overrepresented in the bbb category, and slightly underrepresented in the a and b categories. The pattern is similar for negative surprises, which are also overrepresented in the bbb category and underrepresented in the a category.
- For Nasdaq, the same pattern prevails for bbb, with positive and negative surprises overrepresented. However, positive surprises are overrepresented in the a category and underrepresented in the bb and b categories. Negative surprises are underrepresented in the aa, a and b categories.
- Although these differences are relative, the underlying distribution will still have some influence – the large bbb category for both indexes will usually mean that the arithmetic percentage difference will be somewhat larger for both positive and negative surprises. This is also consistent with the typical credit transition matrix, which shows a high level of two-way activity in the centre of the credit distribution: one implication of this coincidence is that earnings surprise could be a valuable additional early warning credit indicator.
Global coal sector
The Trump administration is strongly supportive of a revitalised coal sector, presiding over an increase in coal production and employment throughout the year. From a very low base, these improvements are reflected in credit data covering a universe of more than 20 coal companies – mainly US ones. However, the sector has a long way to go before it reaches investment grade and the economics of coal production are still very challenging.
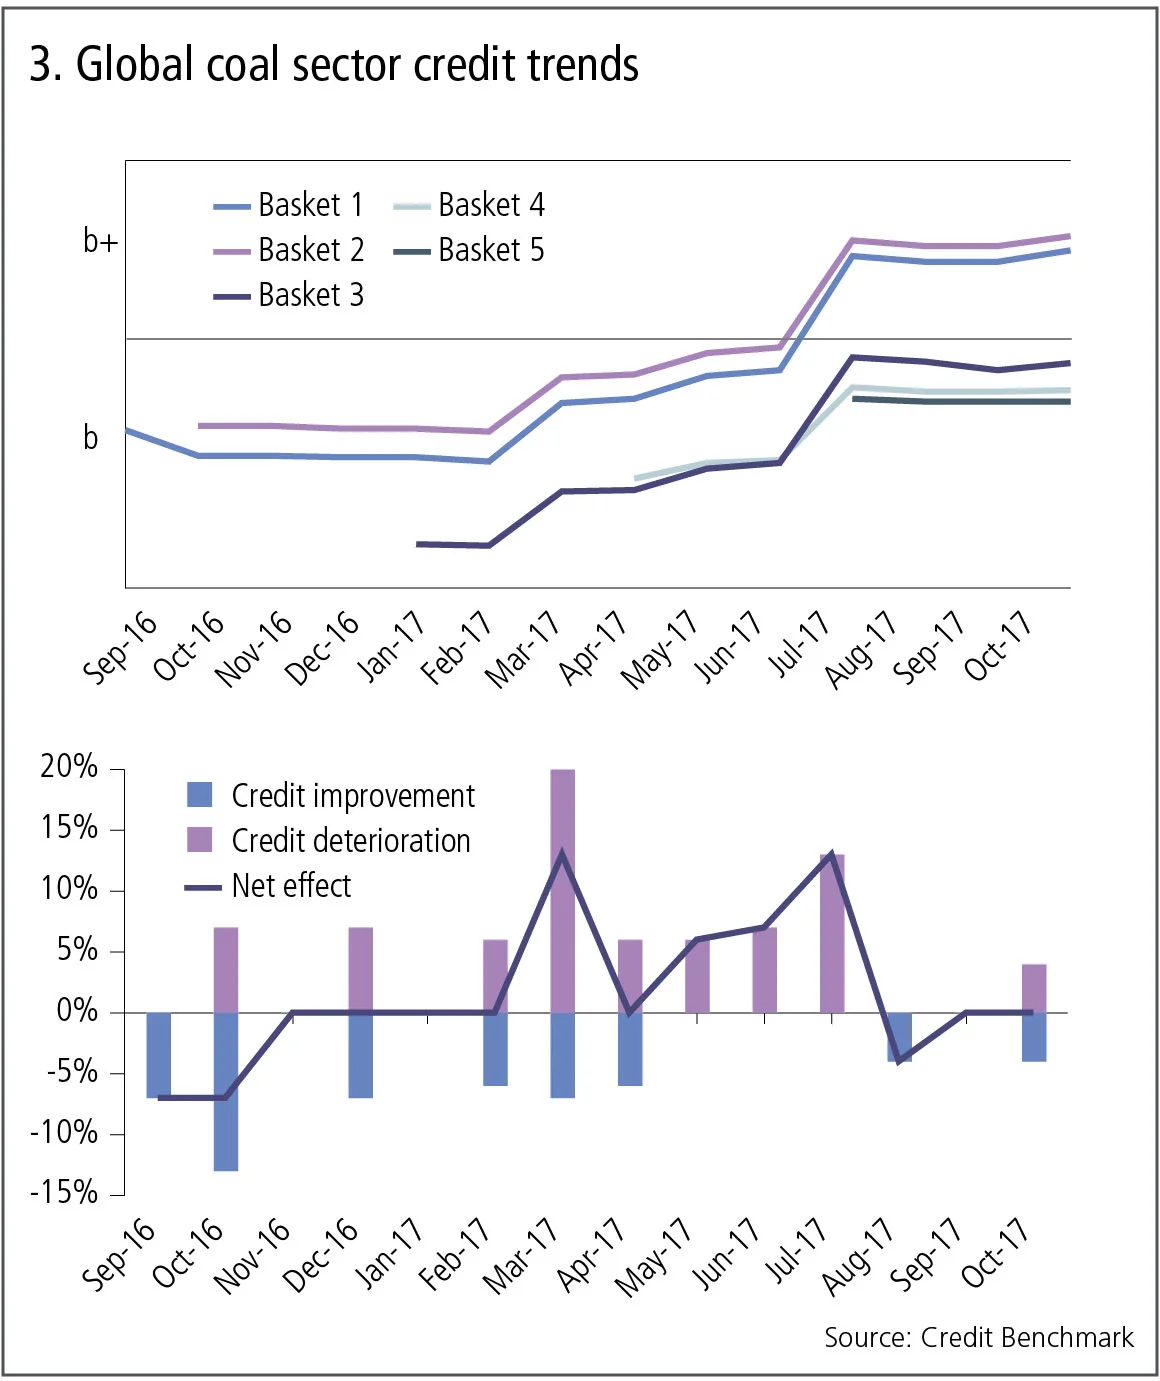
Figure 3 shows:
- Each line in the chart on the top represents the simple average credit risk of a basket of coal companies. There are about 20 obligors in each basket but the actual number varies over time depending on the pattern of bank business. Each line represents the “on-the-run” basket for a three-month period. The initial basket (1) shows a one-notch credit risk improvement from mid b to b+.
- The most recent basket (5) is in credit category b with a similar risk to the opening value of the first basket. This is a good example of a pattern that is often observed in bank-sourced credit data: as the overall credit risk improves, banks tend to take more risk with their choice of borrowers.
- The bottom chart shows the proportions of the basket universe with improving and deteriorating credit. This shows a moderate but clear swing towards improvements over the past year.
Global defence sector
Defence is another beneficiary of the Trump administration with the passing of the National Defense Authorization Act in mid-2017, coinciding with an increase in geopolitical risk. As with coal, the stronger outlook for the sector is reflected in the credit data, again covering a universe of more than 20, mainly US, defence companies.
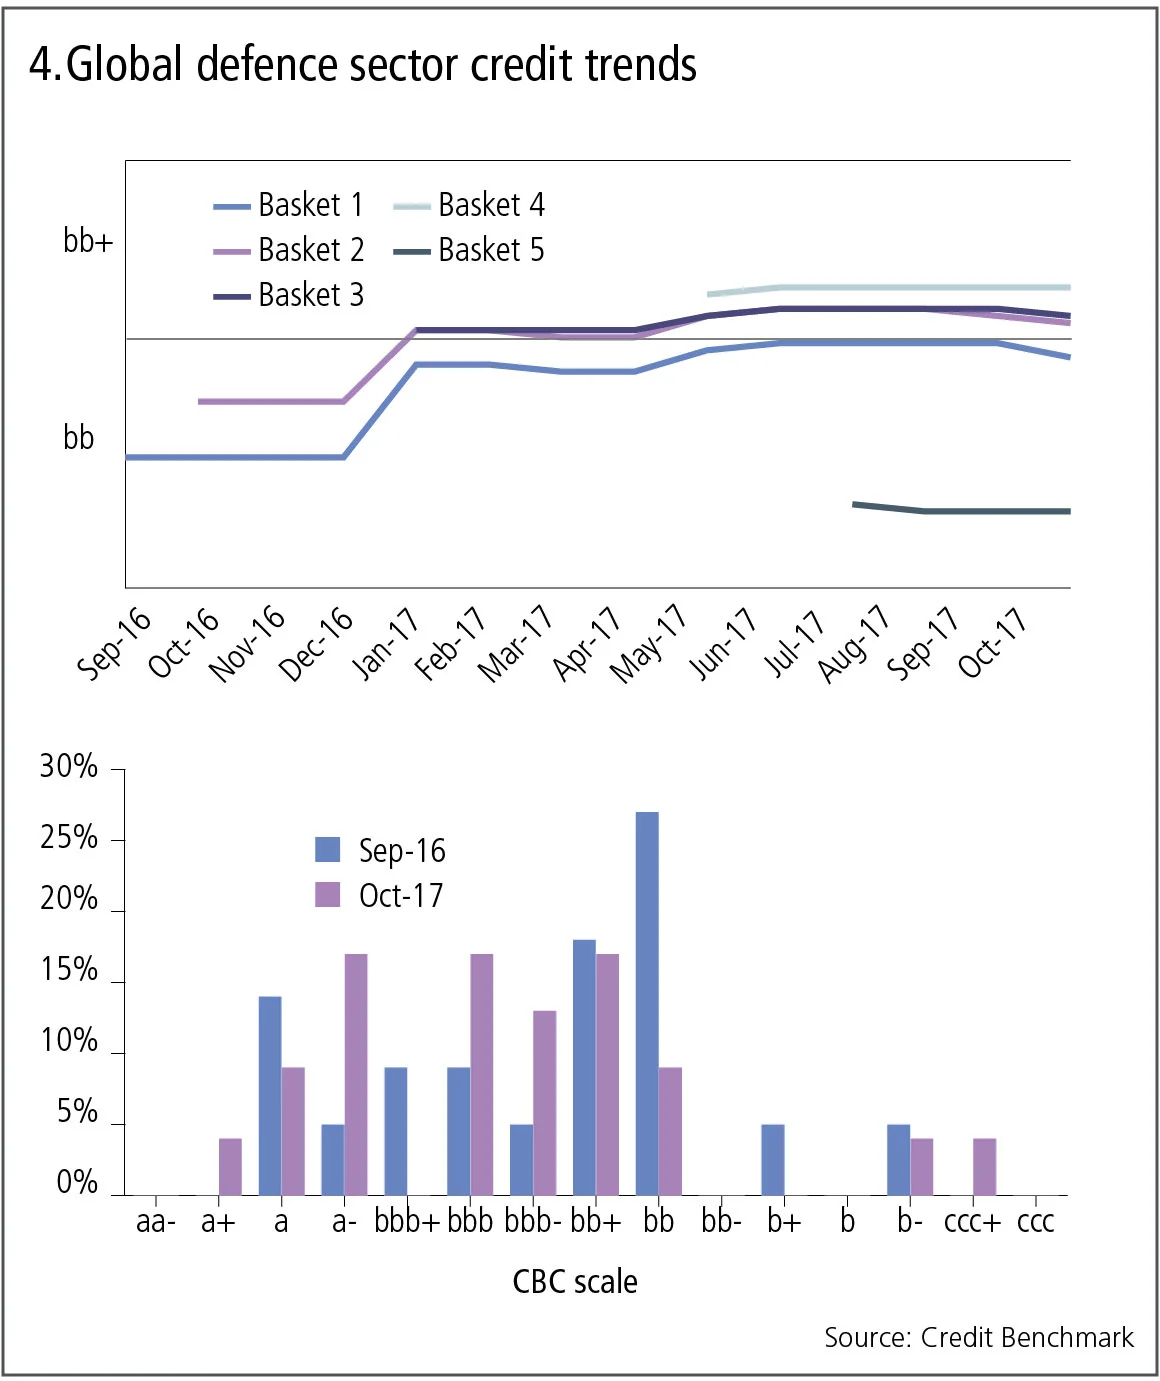
Figure 4 shows:
- The initial basket has improved one notch from a credit risk mid-bb to the bb+ category.
- As with coal, the improving environment has prompted banks to deal with higher-risk names. This movement is particularly dramatic in the most recent basket, where the selection effect gives a credit risk of bb, with higher risk than the initial basket. This suggests banks expect a dramatic improvement in the fortunes of defence companies.
- The bottom chart shows the distribution of the defence universe across the credit spectrum. This shows there has already been a significant improvement in the credit standing of the companies in the sector; the higher average risk of the current basket shows banks expect this trend to continue.
Comparison with CDS prices for point-in-time modelling
Point-in-time model calibration will be a major focus for banks in 2018, as the industry adopts new standards on loan-loss accounting that require the forecasting of lifetime expected losses for loans that are deteriorating in quality. This forecasting requires a blend of current conditions with through-the-cycle losses.
Bank-sourced data provides some useful inputs because the industry’s PD estimates reflect the ‘real-world’ risk of default – they are not market-implied risk estimates, which reflect shorter-term concerns as well as liquidity dynamics – and they tend to come in the form of one-year, through-the-cycle numbers. By applying suitable assumptions about recovery rates and default risk term structures, it is possible to use these inputs to estimate a real-world expected loss, which can provide a benchmark for traded CDSs and support point-in-time model calibration.
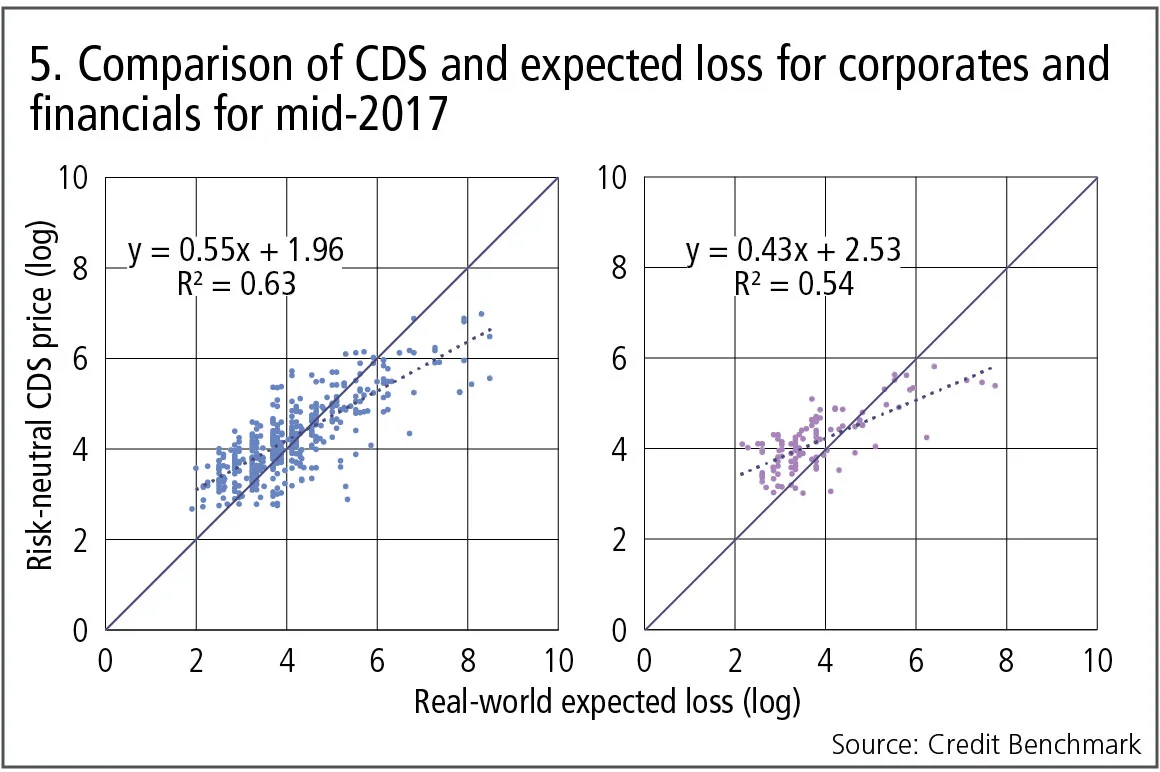
Figure 5 shows:
- In mid-2017, most corporate and financial CDSs were trading at a significant risk premium compared with the real-world estimates.
- However, most of the higher-risk issuers were trading at a discount to the expected loss estimate. This is at least partly due to lower liquidity and higher cost of hedging in the reference bonds, but it may also reflect the prevailing state of the credit cycle. When compared with through-the-cycle measures, negative risk premiums are possible when the credit cycle is in its late phase.
- The intercept in each chart can be interpreted as a base level of risk premium; in mid-2017 it was higher for financials than for corporates. This analysis will be updated in the first quarter of 2018.
About this data
The Credit Benchmark dataset is based on internally modelled credit ratings from a pool of contributor banks. These are mapped into a standardised 21-bucket ratings scale, so downgrades and upgrades can be tracked on a monthly basis. Obligors are only included where ratings have been contributed by at least three different banks, yielding a total dataset of roughly 13,000 names, which is growing by 5% per month.
Only users who have a paid subscription or are part of a corporate subscription are able to print or copy content.
To access these options, along with all other subscription benefits, please contact info@risk.net or view our subscription options here: http://subscriptions.risk.net/subscribe
You are currently unable to print this content. Please contact info@risk.net to find out more.
You are currently unable to copy this content. Please contact info@risk.net to find out more.
Copyright Infopro Digital Limited. All rights reserved.
As outlined in our terms and conditions, https://www.infopro-digital.com/terms-and-conditions/subscriptions/ (point 2.4), printing is limited to a single copy.
If you would like to purchase additional rights please email info@risk.net
Copyright Infopro Digital Limited. All rights reserved.
You may share this content using our article tools. As outlined in our terms and conditions, https://www.infopro-digital.com/terms-and-conditions/subscriptions/ (clause 2.4), an Authorised User may only make one copy of the materials for their own personal use. You must also comply with the restrictions in clause 2.5.
If you would like to purchase additional rights please email info@risk.net
More on Comment
Why the survival of internal models is vital for financial stability
Risk quants say stampede to standardised approaches heightens herding and systemic risks
Shaking things up: geopolitics and the euro credit risk measure
Gravitational model offers novel way of assessing national and regional risks in new world order
Start planning for post-quantum risks now
Next-gen quantum computers will require all financial firms to replace the cryptography that underpins cyber defences, writes fintech expert
Cool heads must guide financial regulation of climate risk
Supervisors can’t simply rely on ‘magical thinking’ of market discipline, says Sergio Scandizzo
Op risk data: Two Sigma pays the price for model mess
Also: KuCoin’s AML fail, Angola bribes bite Trafigura, and Trump’s green scepticism. Data by ORX News
How a serverless risk engine transformed a digital bank
Migrating to the cloud permitted scalability, faster model updates and a better team structure
Op risk data: Mastercard schooled in £200m class action
Also: Mitsubishi copper crunch, TD tops 2024 op risk loss table. Data by ORX News
Transforming stress-testing with AI
Firms can update their stress-testing capability by harnessing automated scenario generation, says fintech advocate


